Can We SEE Progress on Global Warming?
 Since late 2004 The Grove has been supporting an ambitious RE-AMP project in the upper Midwest to clean up the energy system there. Its goal is to reduce global warming pollutants 80% by 2030 from a 1990 benchmark. When we started there were six foundations and 27 NGOs who wanted to approach the problem with systems thinking and collaboration, funded by the Garfield Foundation. Now in 2008 the project has 15 foundations and over 93 members organizations, expanded beyond environmental groups to faith and youth groups, and 140 were going to Ames, Iowa for the annual meeting.
In talking over the design, Rick Reed, one of the initiators of the project at Garfield, posed the challenge. “We’ve got to see what we are doing and where the gaps are. How can we possibly do this at this scale?”
RE-AMP is without question the most organized effort in the country at the moment. But are we making progress? It’s challenges like this that always push us to something new… and this time our solution was a breakthrough in visualization at the system-thinking level.
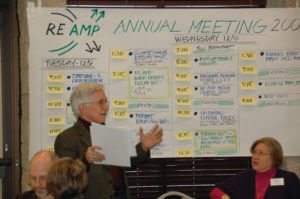
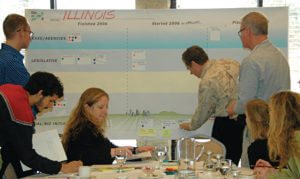
In this picture of me introducing the agenda I’m neatly covering up the part of the meeting that was pivotal. Before I reveal what we designed, let me explain a little more about the challenge Rick laid out.
Systems Thinking
Since the beginning of the project systems thinking has been central to this effort. The project’s original name was the Renewable Energy Alignment Mapping Project (hence RE-AMP) and its intent was to see why foundation funding of renewables wasn’t taking off. They hired a consultant named Scott Spann in 2004 to interview experts and map the multiplicity of factors that determine energy prices. He created a 175 variable causal loop diagram that got compressed into this 16-factor map, which I drew up for our first annual meeting.
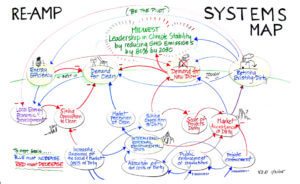
Even though this is a great simplification, it’s an eye chart. If you study it, however, you’ll see four drivers at the top that are the real engines of energy pricing. As they get stronger or weaker they affect the others. The blue lines indicate an increasing effect and red a dampening effect. Out of this analysis Garfield and the RE-AMP Steering Committee decided to fund four planning groups to tackle the issue systemically. Their breakthrough was realizing that in addition to increasing demand for “clean” energy, they needed to increase energy efficiency to handle load (no foundations were funding in this area at the start of the project). They also needed to depress the demand for new coal. There were 24 projects being proposed in this region. And they needed to increase the demand to clean up the 70 existing coal plants. They also collectively realized that the ONLY thing that would make any difference was to reduce global warming pollutants overall 80% from 1990 levels. No one knew how RE-AMP would do this; they just knew that nothing short of this goal would make any difference.
Facilitating System Change
Garfield then went looking for a team to support the project. They needed a facilitator for the four working group or “fronts” as they were originally called. They Grove was chosen for this task. They also brought in a marketing specialist for communications, a designer for a digital commons, and an evaluator. We formed the infrastructure team and worked all during 2005 to create strategic plans and a network infrastructure without any central organization other than the Steering Committee.
The whole RE-AMP story will be told later. Here I want to share how we tackled the issue of looking at our progress.
The four working groups have evolved a bit and all have been busy with dozens of initiatives. There is now one that is called Clean up Coal, headed by Bruce Nilles (Sierra Club), and is tackling both old and new coal. They have stopped 10 plants in their tracks and taken Wisconsin out of the coal business altogether.
Another is about Energy Efficiency headed by Anne McKibbin (Midwest Energy Efficiency Alliance). Foundations are now funding in this area, and they are organized into state-based cadres working legislation, PSC policies, and campaigns to put EE back on the agenda.
A third is focused on New Clean energy, headed up by Michael Noble (Fresh Energy in St. Paul). They are working on how to support the wind industry in the Dakotas, get a workable bio-fuels policy, and look at other new technologies.
A fourth working group on Transportation headed by Eric Sundquist (Center on Wisconsin Strategy) is focused on clean fuel standards, public transit, and such.
A fifth group was formed two years ago called the Global Warming Strategic Action work group, headed by Keith Reopelle (Clean Wisconsin) to work at a regional level of CAP & Trade options, hoping the Midwest could lead the country in initiating these ideas.
A sixth working group is the Foundation Working Group composed of the funder organizations.
All of these work groups have done a lot of work across the seven states plus Ohio. As attention to global warming has accelerated, five of the RE-AMP states have governors’ task forces on the issue, heavily guided by RE-AMP players. The Midwest Governor’s Association is coordinating these actions and will have reports out next year.
So How Can We See If We Are Making Progress?
RE-AMP hired the Center for Climate Strategies to do an analysis of the numbers. Matthew Brown kicked off the annual meeting with this report, and a “wedges” chart that showed what the impact of current RE-AMP efforts will be. It comes in about half of what it needs to be. The news was sobering, but attention and action is accelerating. The RE-AMP community needed to see what is was doing.
So we stepped up and thought, “How can we literally help them SEE the region as a whole.” We were in a huge room at the Gateway Convention Center new the Iowa State University. Could we get everyone involved in creating a graphic picture of everything that is going on?
I remembered a system we worked out for another client, of having everyone create charts at the same time within a template structure and thought this might work. Working with Rick, we developed a framework unique to RE-AMP. Here is what we came up with…
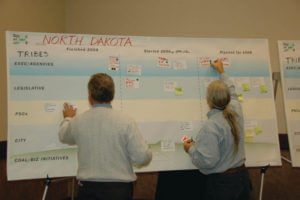
This picture of the North Dakota group shows the green ground line as a row for what is happening with coal and business. Above that is a blue row for city action, then a yellow PSC (the public service commissions) row, then legislative as light blue, then executive level and agencies as darker blue. The colors allowed everyone to follow the bands visually around the room. Then each had a column for what was completed in 2008, a middle column for what was started in 2008 (and before), and right hand column for what would be started in 2009.
We provided the group with large Avery labels (four to a page), Sharpies and Charters Markers, and dots to represent the working groups.
• Black for Coal
• Blue for Clean Energy
• Green for EE
• Orange for Transportation
• Red for Global Warming campaigns
Each piece of legislation, policy or action was indicated on a label with the dots showing the focus. THEN each organization created a small, square sticky and put it near the work they had supported or will support. We have green squares for the environmental NGOs, blue for Faith groups, and yellow for the Youth.
Here is the Illinois group working.
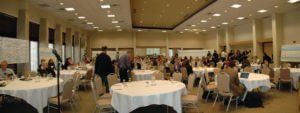
When all these charts were around the room it created quite an environment. You can a bit of an idea from this full room view.
Creating a County Fair of Action Ideas
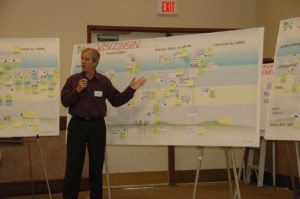
It was appropriate we were in Iowa, for this felt like a harvest festival at a county fair. People were amazed at everything that was going on, and cruised the room to look at other states. For an hour everyone co-created a systems level view of each state’s progress. Many people were able to network and talk in the midst of it all. We then spent the next hour giving verbal overviews of each chart. (Here is Keith Reopelle giving Wisconsin’s presentation).
After lunch we had the different work groups do a visual tour of all the states after lunch before they jumped in to set their 2009 goals. We had then pick a state to begin with, then spend about 3 minutes per chart and rotate.
Laurie Durnell, my Grove colleague, and the RE-AMP Steering Committee were very excited about the result. I felt like we’d modeled another breakthrough in how to think systemically and act collaboratively. Of course we are providing 11×17 digital capture of all eight states and the Midwest Governor’s Association progress in both hard copy and pdf format.
Getting Things Going Elsewhere
I’m now working to see if we can get a RE-AMP type project going in California. Rick Reed is thinking about other areas. We know that collaboration can work and have a sense of the conditions that make it possible. And if ever a time felt ripe for this kind of work it is now!!!
Robin
January 13, 2009This is great material in an increasingly complex time. I’m impressed!