Strategizing with Visual Metaphors
As the rain and winds ripped trees down in our backyard and beside the Grove in our first serious winter storm, I left the VizThink web-conference exhilarated and thinking a lot about visual analogies and metaphors. My reflection was sparked by a question moderator Tom Crawford passed along from one of the 53 people participating. “What role does the third dimension play in your Storymaps?”
I illustrated my answer with the tablet sketch below. Let me elaborate.
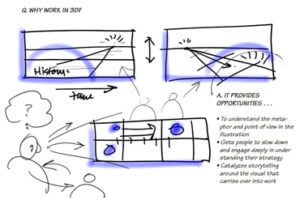
I found myself talking about the difference in point of view, relative to time, that the third dimension allows (in a mural that is dealing with vision and strategic direction). In a two-dimensional graphic world, narratives go left-to-right. Other qualities like degree of manifestation (from imagination to concrete reality) can be mapped top-to-bottom. On a flat 2D timeline the content has the same emphasis whether it is represented as being historic or in the future. Adding the third dimension allows strategic emphasis on either history or the future, depending on which is illustrated in the foreground.
Why Worry About Emphasizing Past or Future?
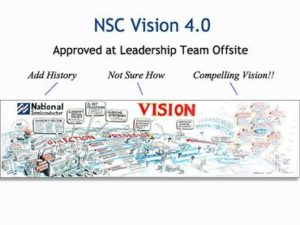
I found myself talking about the importance of facilitating leadership groups in engaging in dialogue around the issues that are most critical for alignment and action, as distinguished from leaving it up to the illustrators. In some cases dealing with history and conflicting stories about the past is the primary issue in change, and deserves to be foreground. This was the case with National Semiconductor, which was facing a turnaround in 1990, largely because of getting bogged down in a huge merger.
The original vision didn’t have history, but when it was reviewed at a quarterly offsite, all the leadership insisted on history being included. The mural was being created to be used to orient leaders attending a special Leading Change workshop aimed at getting everyone aligned on the vision. As a result the balance of this mural had a stronger emphasis on the past, with the left side pulled more toward the foreground, than the future, which lay over the horizon, a bit farther away.
In other cases the future is much more the issue and ought to be in the foreground. This was true for a consumer goods client that wanted to have its future customers and target markets as the center of their dialogue, and pulled toward the front of the picture. This kind of shift in the 3D context many not even be noticed by the viewer, but greatly influences how they interpret the content that becomes “figure” in the drawing.
Link to Strategic Planning
As these thoughts circled in my mind, preparing to work on updating our Grove Strategic Visioning Overview booklet, I serendipitously picked up a 2005 article I’d clipped from the Harvard Business Review called “How Strategists Really Think: Tapping the Power of Analogy.” Gavetti and Rivkin argue that there is a middle ground between formal, deductive analysis, which works well in information-rich, more mature industries, and trial and error, almost a necessity in very dynamic, untested emergent industries. “Many, perhaps, most strategic problems are neither so novel and complex that they require trial and error nor so familiar and modular that they permit deduction. Much of the time, managers have only enough cues to see a resemblance to a past experience. They can see how an industry they’re thinking about entering looks like one they already understand, for example. It is in this large middle ground that analogical reasoning has its greatest power.”
Traps in Analogical Thinking
They go on to explore traps arising from being too casual in connecting between their own organization and the analogous situation they are comparing with. They explore in depth the Circuit City analogy that their business model would work with cards in their CarMax business. It took them 10 years to get it “adjusted” and provides a powerful case study in what the authors call a deep analysis of structural similarities. You can read the article yourself, but I immediately related through the years of experience I’ve had with managers arguing over the correct graphic metaphor to use in their history or vision murals, basically immersed in the precise conversation Gavetti and Rivkin are talking about. I came to see that one of the enormous contributions visualization makes to this process is making the analysis of analogies explicit and more rigorous. Having every graphic image on the National vision thoroughly vetted by leadership gave it enough authority to be recognized by 95% of the company worldwide after three years of communications about it. While not a single factor, the amount of alignment this process allowed was certainly helpful in the successful turnaround.
Does Framing Control Interpretation?
As I toggled between the article and thinking about VizThink, I found myself intrigued with the differences in the way this issue of analogizing is “framed,” to borrow from George Lakoff’s terminology (I saw him on a Virtually Speaking lecture in Second Life last night). The frame of “strategy by analogy” is different from “visual thinking.” These labels are metaphors that provide a framing context that directly affects what a viewer or listener pays attention to. And within the visual work the choices of what to illustrate, and most critically, the organizing graphic metaphor and its emphasis, open and close opportunities for engagement, discussion and interpretation. I know this is a great source of visual planning’s effectiveness, both during forumation of ideas and later when communicating about them.
But the “strategizing by analogy” frame is provocative of important distinctions as well. I’m inspired now to push deeper into how our Visual Planning™ approach at The Grove and ask how it can be made even more rigorous. The consequences of superficial thinking when entire organizations, communities and public policy are at stake makes it worth the extra effort!
Beats Headphones
December 8, 2010Hello,
Enjoyed the video. That must have been a ton of work. Very cool, though.
Have you ever looked at a data visualization tool called Tableau? My link above is a work in progress, but when i was searching for information viz experts, i found your site. They are a client of mine and i’m trying to find the best information and data visualization experts out there.