Visual Meetings: A Revolution in Group Productivity
This post links you to a video about my presentation on Visual Meetings at a recent TEDxSOMA event at the ParisSOMA loft, South of Market Street in San Francisco. ParisSOMA is a shared workspace for young entrepreneurs, very much in the spirit of the TED events. Its motto is “ideas worth sharing.” My Parisian college Meryem Le Saget introduced me to the sponsor Clement Alterseco, President of FaberNovell in Paris, several months ago and it led to the invitation.
My own ideas, formed over the 38 years I’ve been a visual practitioner, are condensing into a book for Wiley & Sons on the subject that will come out this summer. This 10-minute fly-over is a fast-paced review of what feels like a real revolution in how we communicate in organizations.
 Merc Martinelli—CEO of a new startup, Verdafero, focusing on green business.—sent me a link to an incredible
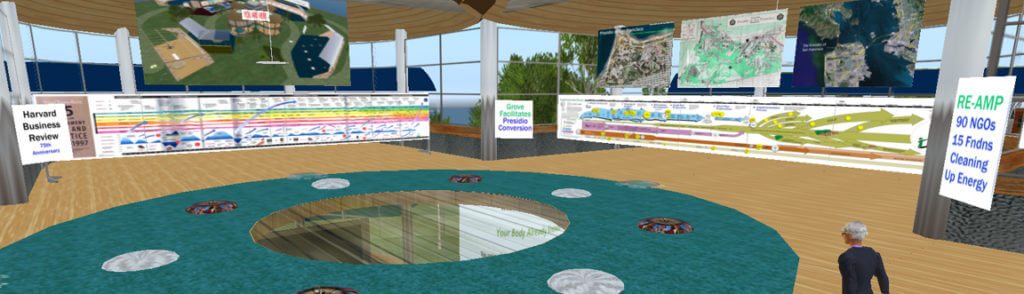
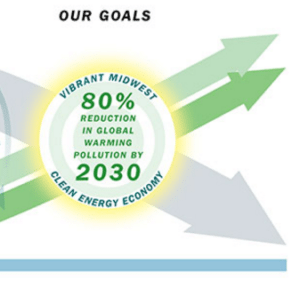 Since late 2004 The Grove has been supporting an ambitious RE-AMP project in the upper Midwest to clean up the energy system there. Its goal is to reduce global warming pollutants 80% by 2030 from a 1990 benchmark. When we started there were six foundations and 27 NGOs who wanted to approach the problem with systems thinking and collaboration, funded by the Garfield Foundation. Now in 2008 the project has 15 foundations and over 93 members organizations, expanded beyond environmental groups to faith and youth groups, and 140 were going to Ames, Iowa for the annual meeting.