Visual Meetings Arrives at The Grove
Imagine holding the book you see here in your hands, and knowing that you wrote, illustrated and designed all 262 pages! I got that chance last Friday when Visual Meetings arrived from Wiley & Sons. The process began in December of last year when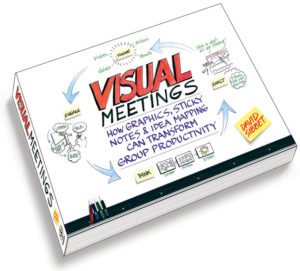 Richard Narramore called and wondered if I would like to write a book about visualization for groups, following the success of Dan Roam’s book Back of the Napkin. Little did I realize then how fun it would be to deliver this sweeping review of 35 years of leading visual meetings all over the world.
I’m writing here to share some of the process I went through for those who might be interested in how books like this come to be. If you want to skip this post and go right to getting the book, then click on this link to a special page on The Grove’s website. If you want to hear my personal story of this journey, read on.

 That was back in 1977 when I set up a personal consultancy focused on organization development, communications, and graphic & design. My logo was a bright yellow spot, looking a bit like a light bulb. Here’s the image. (Note: I don’t live on 6th Avenue any more.)